Instrumenting Without a Vendor Footprint When MCP Is Your Analytics Interface
Instrument the governed data layer, not the dashboard, and keep agents off Postgres.
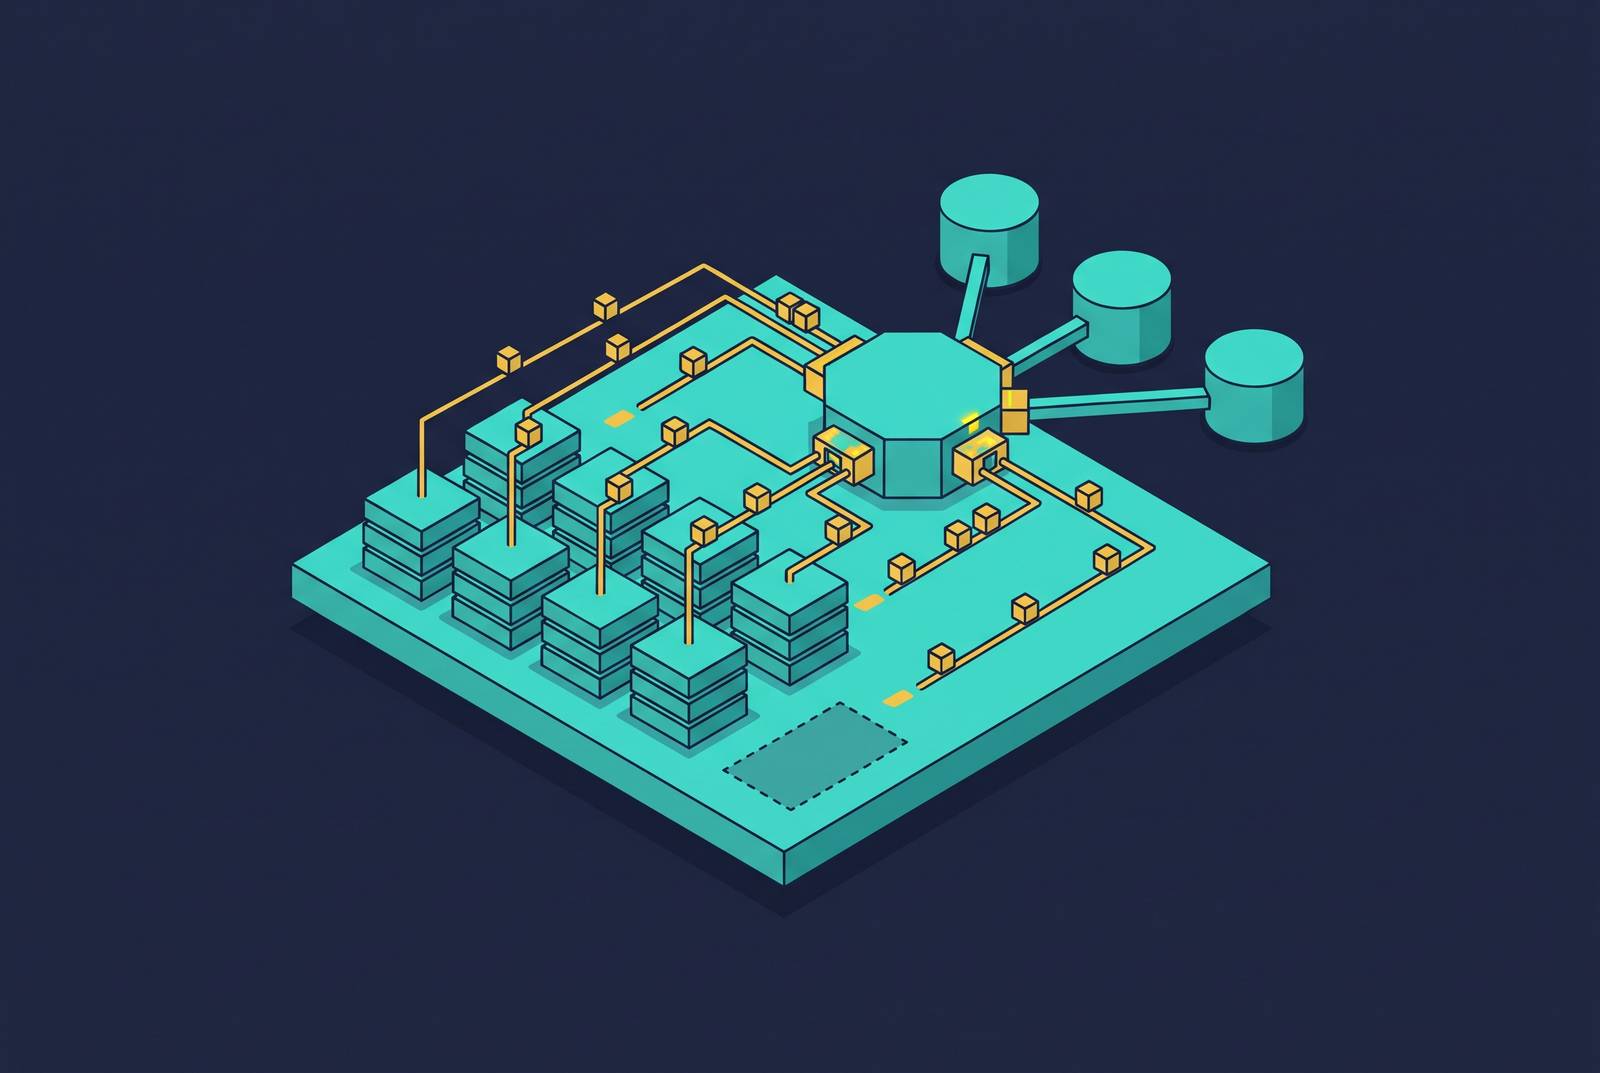
When MCP becomes the analytics interface, instrumentation must serve the governed data layer. The architecture separates metric definitions, permissions, and modeled datasets from the tools that consume them. For Supabase teams, that means keeping analytical requests away from production Postgres while giving agents and dashboards the same business definitions, without building instrumentation around any single vendor’s requirements.
Why MCP changes where the instrumentation question lives
In a front-end-led architecture, teams instrument for the BI tool’s requirements. With MCP, they instrument for the data layer’s contract. Before there was a shared interface standard, teams had to build custom authentication, formats, and error handling for each AI-to-data connection. As agents and sources multiplied, so did the bespoke integrations. Standardizing that connection removes a consumer-specific boundary, but it leaves the shared layer responsible for defining what consumers receive.
MCP exposes more than a retrieval mechanism. Its three primitives include Tools for executable functions such as queries, Resources for governed datasets and schema context, and Prompts for reusable analytical templates. Together, they provide data, context, and workflows through one interface. Instrumentation decisions therefore belong beneath the interface, where every consumer can inherit them independently of a dashboard vendor’s final interpretation.
What the 2026-07-28 specification change actually means for teams building analytical MCP servers
The 2026-07-28 MCP specification makes the protocol stateless at the protocol layer. It retires the initialize/initialized handshake and the Mcp-Session-Id header. The MCP architecture documentation describes how each request instead includes its protocol version, client identity, and capabilities in its _meta field. The request supplies the context previously exchanged at connection time. That change lets an analytical MCP server behave as shared infrastructure.
Server instances can run behind a plain round-robin load balancer with no need for session affinity or shared protocol state. Concurrent agents querying the same metric definitions no longer require a stateful broker at the access layer. That layer can scale independently of the analytical store. Teams can then spend separately on more access capacity and more analytical capacity.
The specification does not define metrics or permissions. The data layer must decide which datasets a server exposes and which clients may read them before clients connect. The protocol is ready to serve as infrastructure, but the data behind it needs an equally deliberate contract.
Why governance becomes the bottleneck the moment MCP standardizes access
Standardized access amplifies disagreements that bespoke connections could keep separate. If three analysts use different definitions of a conversion event, agents that use the shared server meet that same disagreement through one interface. Fixing each connection on its own no longer settles that disagreement. Improvado’s AI Product Lead makes this causal point directly, noting that agents expose naming gaps, permission gaps, and metric-definition conflicts faster than human analysts.
The failure can be as simple as competing revenue calculations. One engineer uses SUM(revenue), while another uses SUM(amount_captured). An agent querying both surfaces can return different Q2 revenue figures with equal confidence, without flagging either as wrong. A data dictionary with one agreed meaning for “Churn,” “Active User,” and “ARR” is therefore a precondition for trustworthy answers.
Direct agent queries against production risk bypassing row-level security. A governed analytical copy with its own scoped access rules keeps the rules for who can read data the same whichever agent asks. Governance becomes the bottleneck because standardized access brings unresolved definitions and permissions into a common path.
Why Supabase projects face this governance gap earlier than most teams expect
Analytics against production Postgres puts competing workloads on the same system. Transactional work runs best with fast, random, row-level reads and writes. Analytical work runs best with sequential full-table scans, large aggregations, and multi-table joins, which can hold locks and use shared I/O for seconds. On a shared instance, those analytical requests can crowd out transactions. Agent-driven reporting makes that competition recurrent.
An agent that scans event tables every few minutes uses production capacity for the same analytical task over and over. Concurrent agents compound that load and can exhaust the connection pool. This database bottleneck persists as MCP instances are added and can affect a team well before it reaches enterprise scale.
Supabase’s documentation provides a concrete signal of the workload distinction. Its Analytics server, Logflare, supports Postgres or BigQuery for log ingestion, but the documentation states that the Postgres backend is not yet optimized for high-volume inserts or heavy query use. Supabase recommends BigQuery for production self-hosting of that service. That recommendation concerns the logging backend specifically, but it reinforces the need to choose storage around workload rather than assume one Postgres instance suits every use.
The architectural pattern that resolves the tension — pre-modeled data behind a governed MCP server
The resolving pattern uses Postgres as the source of truth without querying it at analytics time. Metrics are calculated and materialized before agents or dashboards request them. A governed layer then serves the modeled results through a read-only, token-efficient MCP or API interface. Production and its connection pool stay outside that request path.
A single metric definition governs each consumer’s result. A founder, investor, support rep, and agent receive the same number because the calculation belongs to the shared layer. Headless analytics makes this separation explicit. Analytical logic sits apart from the dashboard UI, while APIs and MCP expose shared datasets and definitions to both human and agent interfaces.
ZoomInfo’s GTM.AI demonstrates the enterprise viability of that separation. Generally available June 1, 2026, it is a headless, MCP-native layer with no user interface of its own. It grounds surfaces including Claude, ChatGPT, Microsoft Copilot, Salesforce Agentforce, and HubSpot Breeze in verified data. Data grounding is a distinct, purchasable layer independent of the front end. For instrumentation, the consequence is that defining the metric, setting its permissions, and materializing its dataset establish the contract every consuming interface inherits.
What belongs in the governed data layer and what does not
The governed layer is a deliberately scoped set of modeled metrics and datasets with agreed definitions and enforced access rules. For a B2B SaaS startup, the initial set includes CAC, LTV, monthly churn, ARR, and gross margin. These cover the core decisions at seed and Series A. Broader exposure should not precede agreement on those calculations.
The data dictionary makes that agreement operational and explicit. Each metric needs one definition, one owner, and one source calculation. Raw event tables, schema internals, unmasked PII columns, and datasets with contested definitions do not belong in the exposed layer. Publishing a disputed metric distributes the ambiguity to every consumer that can discover it.
Resources provide the appropriate primitive for governed, read-only datasets. Reading an already modeled churn dataset is different from invoking a Tool that runs an arbitrary query against production. The server design should encode that distinction. Where Tools are needed, they should operate on the governed copy within explicit permission boundaries.
Prompts give repeatable analysis a similarly defined shape. A weekly churn report, CAC trend query, or cohort comparison can use a reusable analytical template. Resources establish the available context, while Prompts codify how repeatable questions use it. Together, they keep the exposure layer useful without turning it into unrestricted access to the source database.
How Supabase's observability infrastructure fits into the governed layer without duplicating it
Supabase’s one-click Grafana Cloud integration provides the infrastructure view. Available as of late July 2026, including on free plans, it gives teams a pre-built metrics dashboard that needs no custom setup, and they can get alerting separately through Grafana. That view answers questions about database health. The governed analytical layer answers questions about the meaning of business data. Neither replaces the other.
For scaling decisions, teams need Postgres exporter, Realtime Prometheus metrics, and structured logging from day one. Dashboards showing p50/p95 latency provide evidence for decisions about read replicas, compute, and workload separation. OpenTelemetry export for logs, metrics, and traces also supplies query-level signals for tuning the governed layer. Without those signals, capacity decisions lack a workload diagnosis.
Supabase’s published compute tiers extend to 64 CPU cores and 256 GB of RAM. Its available infrastructure includes Supavisor connection pooling, read replicas, point-in-time recovery, and multi-region read scaling. These options address different operational needs, so the constraint must be identified before a scaling choice follows. More capacity is not the same as separating workloads.
The handoff between the layers is a diagnosis. If a p95 query latency spike in Grafana comes from an agent scanning an event table for a business metric, the metric belongs in the pre-modeled analytical path. Infrastructure monitoring identifies the pressure. The governed layer removes the need to answer that business question through a live production scan.
Serving agents and dashboards from the same layer without instrumenting twice
Governed Parquet files queried through DuckDB provide one concrete implementation path. They give agents and dashboards read-only access to the same pre-calculated numbers without querying production or consuming its connections. The shared dataset also removes the need for each consumer to calculate the metric independently. Interfaces differ in presentation and access while sharing the definition of the business result.
A single MCP server can expose those datasets to compliant agents and applications. Its discovery mechanism lets clients find the governed capabilities without a bespoke connector for every agent-source pairing.
Distribution can follow the same model as interactive access. Metrics delivered to an inbox, Slack, or mobile are calculated ahead of time rather than triggered by someone remembering to open a dashboard. The agent and the human founder receive the same figure without either initiating a production query.
What a team actually does on day one to instrument for an MCP-first analytical architecture
The starting sequence runs from observability to definitions to governed exposure. First, a Supabase team should connect the one-click Grafana Cloud integration to establish baseline CPU, IO, connection, and latency metrics before adding analytical workloads. It should also enable OpenTelemetry export for logs, metrics, and traces. Those signals provide the basis for later tuning. They establish what the production system is doing before analytical access changes its workload.
Next, the team should agree on its core metric definitions. For a B2B SaaS startup, that means CAC, LTV, monthly churn, ARR, and gross margin. Before materialization, the data dictionary must name the source columns for each calculation and give its definition. A contested definition should remain outside the exposed dataset until the disagreement is resolved. Publishing two versions would move the argument into every consuming interface.
Once the team agrees on definitions, it should materialize the analytical copy and set its scoped access rules separately from production row-level security. Agent requests should never enter the production connection pool. The copy can then support the same modeled datasets for dashboards and agents. This step separates the cost of preparing a metric from the cost of reading it.
Finally, the team should make the governed copy available through one MCP server. Resources provide read-only datasets, Prompts codify recurring analytical workflows, and any Tools stay within the copy’s explicit permission boundaries. The stateless protocol supports horizontal scaling as agent traffic grows. New agents and dashboards become consumers of an existing contract, while changes to metric definitions remain deliberate changes at the data layer.