MCP Tool Handlers as the Analytics Interface for Agents That Bypass the Dashboard Layer
Governed MCP handlers give agents trusted metrics without dashboards.

A headless analytics platform for API-first and agent-first teams should expose governed metrics through APIs and MCP tool handlers, without requiring a prebuilt dashboard UI. For agent analytics to be trustworthy, those handlers must serve pre-modeled data through a controlled gateway and keep arbitrary queries away from production. For Supabase and Postgres teams, this separates analytical access from production connection pools while preserving shared metric definitions for humans and agents.
Why analytics is shifting from a destination humans visit to infrastructure agents consume in-flight
The dashboard-centric model assumes a human will open a tool, find the right view, select a date range, and interpret the result. An autonomous agent can call a snapshot tool, compare the result with the prior period, and surface an anomaly in a 30-second exchange. The contrast is between retrieving a view for a person and supplying context to a process already doing work.
That process already has the codebase, database, and git history as context. Analytical data becomes another input to that process, so it no longer sits in a report waiting for someone to fetch it. The integration infrastructure has gained broad adoption. By mid-2026, MCP SDK downloads reached 97 million per month, and OpenAI, Google, Microsoft, and AWS had adopted the protocol. Anthropic donated MCP to the Linux Foundation’s Agentic AI Foundation, placing the interface beyond a single vendor’s agent environment.
What MCP is and how its three primitives create an analytics interface for agents
MCP uses a client-server architecture in which a host, such as Claude Desktop, VS Code, or a custom agent, contains a client that manages connections. Each server is a lightweight program that makes its capabilities available through Tools, Resources, and Prompts. Instead of building a separate integration for every combination of agent and analytical service, providers implement a common protocol that clients can use across servers.
Tools execute actions, including fetching a metric snapshot or running a query. Resources give agents persistent context, such as schemas and governed datasets, which is especially useful for pre-modeled analytics. Prompts provide reusable templates for repeatable analytical workflows. These primitives serve different parts of the task. A tool retrieves the result, resources give the agent the context needed to interpret it, and a prompt supplies a workflow that does not need to be reconstructed each time.
This structure separates retrieval from interpretation and workflow. This helps when answers must follow definitions that are set outside the model. A server can expose a governed dataset as context and a bounded operation for retrieving its metrics, rather than leaving the agent to invent the calculation. MCP supplies the interface for that arrangement. It does not, by itself, supply the governance behind it.
How the July 2026 stateless spec change makes MCP viable for shared analytical services at scale
The July 28, 2026 MCP specification removed protocol-level sessions and the Mcp-Session-Id header from Streamable HTTP. The protocol core became stateless, so requests can reach any server instance behind a plain round-robin load balancer without sticky routing. Concurrent agents can query metrics across server instances rather than remain tied to a particular instance through a protocol session.
Transport choice still requires attention. The specification deprecated SSE transport on March 26, 2025, although the public registry still accepted SSE-only listings and 730 SSE-only servers remained active as of October 2026. Production analytics servers should therefore use the current transport from the start. Agents querying production Postgres can still exhaust its connection pool, regardless of how many MCP server instances accept their requests.
How do you add usage analytics to an agent without a dashboard, and what should handlers expose?
Production servers show that “analytics through MCP” covers distinct jobs. Pipeline-focused handlers let agents build and execute data workflows, while dashboard-focused handlers support visual exploration and generation. Metrics-focused handlers expose governed, semantically defined numbers. The important distinction is whether a handler retrieves an established calculation or gives the agent the freedom to construct one.
The available interfaces also differ by use case. Sentry’s OAuth-secured server exposes tools including search_issues, get_issue_details, search_events, update_issue, and analyze_issue_with_seer, fitting issue investigation and action. Mixpanel’s remote server provides read-and-write access to events, funnels, retention, dashboards, and Lexicon management through OAuth 2.1. LogRocket exposes sessions, metrics, and issues through OAuth or API key authentication for engineering teams investigating user-reported problems. Microsoft Clarity’s local, open-source server runs through npx with an API token and covers traffic, scroll depth, engagement, and session recordings. Each interface has a distinct analytical scope.
A no-dashboard web analytics implementation demonstrates a more compact interface. Its 42 MCP tools cover traffic, sources, funnels, session paths, events, and performance, with shortened response keys and a full snapshot of approximately 55 tokens. Context consumption constrains handler design. Tool schemas alone can consume most of an agent’s context window when it connects to multiple servers, so selective exposure and compact responses are necessary.
For trustworthy metric retrieval, that selectivity must also restrict authority. Handlers should not expose raw SQL passthrough, production-table write access, unscoped credentials, or interfaces that let the agent construct arbitrary metric logic. Each option moves a governance decision into the model. A pre-calculated metric handler instead defines both the answer available to the agent and the operations it cannot perform.
Why pre-modeled, governed datasets — not live query passthrough — are what make MCP-served analytics trustworthy
A live database query can return a valid number that differs from what a dashboard would show. Metric drift begins when agent SQL and dashboard SQL disagree about a term such as “active user” or “churn.” Syntax is not the test of consistency. If each consumer assembles its own definition, the interface cannot promise that the resulting answers describe the same thing.
The semantic layer supplies that missing control. When definitions are pre-modeled in governed datasets, the agent calling a tool and the human reading a dashboard use the same calculation. A definition changes once and propagates to its consumers. This also changes the cost of retrieval. Materialized views and pre-calculated Parquet datasets compute complex aggregations once rather than repeating the work for every analytical question.
The rungu implementation illustrates the pattern with get_analytics and get_top_posts. These tools return aggregated counts, including totals by event type, trend buckets, and conversion ratios, from a schema storing no IP, no cookies, no fingerprint, and no user agent. The human dashboard was designated a follow-up. Here, the analytical contract comes before the visual interface, so the agent gets defined aggregates without having to create the metric logic behind them.
The governance gap that MCP tool handlers currently expose — and why it is worse than it first appears
MCP calls can run outside an agent harness’s approval and audit path, even when native tools pass through it. A July 2026 issue against the Temporal Agent Harness documents that specific gap. Calls dispatched through stateless_mcp_server() route directly to a Temporal activity without passing through run_tool, where ToolApprovalPolicy is evaluated and tool_start, tool_end, and tool_error events are emitted.
The consequence is a split in tool governance. Harness-native tools show their lifecycle on the turn stream and can be approval-gated, while MCP tools can execute without appearing there. In that documented path, an MCP tool that writes or destroys data would run without an approval gate or an audit entry. It is unlogged as well as ungated.
This is an architectural blind spot in the documented dispatch path. Whether the control is applied depends on the dispatch path. A bug in agent logic, unexpected input, or prompt injection could reach a write-capable handler and corrupt production data, with no turn-stream audit trail to show the call.
Why gateway-mediated access to a governed analytical copy is the correct architectural response
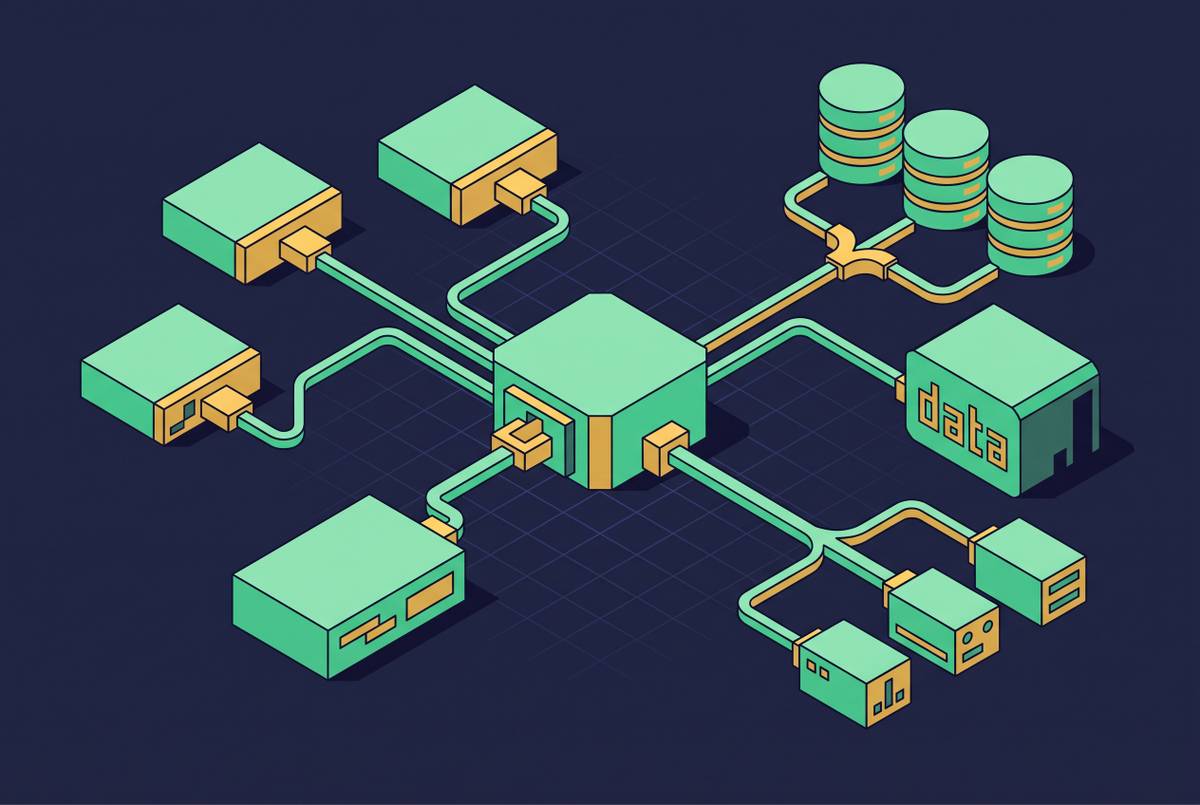
The architectural response is to route all analytical tool calls through a centralized gateway before they reach data. The gateway handles authentication, tool whitelisting, and audit logging, while the handlers access only a governed analytical copy. These controls address separate failures.
When servers connect directly to production, credentials are spread across those servers, and there is no central place for observability or policy enforcement. A gateway consolidates those responsibilities. For Supabase and Postgres teams, the data boundary addresses two additional risks, namely production connection-pool exhaustion and queries that may bypass the row-level security rules applied to human-facing access. Adding stateless MCP instances cannot remove either concern. More access-layer capacity does not create more production connections or establish the correct scope for a query.
Production observability remains necessary to distinguish ordinary load from agent-driven pressure. The recommended stack includes pg_stat_statements, which records query mean time, total time, and calls, plus auto_explain for plans of queries exceeding a latency threshold. Self-hosted PostgreSQL requires pg_stat_statements to be added to shared_preload_libraries, while some managed services such as Supabase enable it by default. Postgres exporter and Realtime Prometheus metrics belong in the stack from day one. Without this instrumentation, teams have no p50/p95 baseline to help them understand query pressure.
The workload recommendation is correspondingly explicit. Expensive reporting should move off production to replicas, materialized views, or dedicated analytical systems, though how well it is isolated depends on where those calculations run. A gateway-fronted MCP server backed by pre-modeled Parquet datasets queryable through DuckDB provides the governed-copy pattern. Agent requests get pre-calculated context without touching production. The analytical layer can then scale on its own without sending more requests to the same bottleneck in production connection pools.
Where MCP tool handlers fit alongside dashboards — and what teams should stop building manually
Dashboards are still useful for high-level monitoring, overviews for executives, reports for the board, and recurring reports that need to look the same each time. A pure MCP interface does not meet every need. The no-dashboard analytics experiment explicitly identifies charts for a board meeting as a limitation of the format. That boundary leaves substantial work for tool handlers, including ad-hoc questions, context an agent needs during a task, and exploratory analysis triggered by an anomaly.
The operational change is that analytical context can become automatic. In the agent-native experiment, three lines near the top of CLAUDE.md pointed to a skill file and prompted the agent to add tracking to new features. Position mattered more than length in that experiment.
For Supabase founders and small teams, the practical implication is to stop building permanent views merely to look up a number. A governed MCP layer backed by pre-calculated metrics can handle those requests, while metrics move automatically to the inbox, Slack, or the agent’s context. The visual interface becomes a choice of presentation. The governed layer must remain the shared source of truth, because definitions left outside it can drift, regardless of whether their answers appear in a chart or a tool response.