Wiring an MCP Analytics Server Into Supabase so Agents Query Governed Metrics, Not Raw Tables
Agents get approved metric views and scoped roles, not tables.
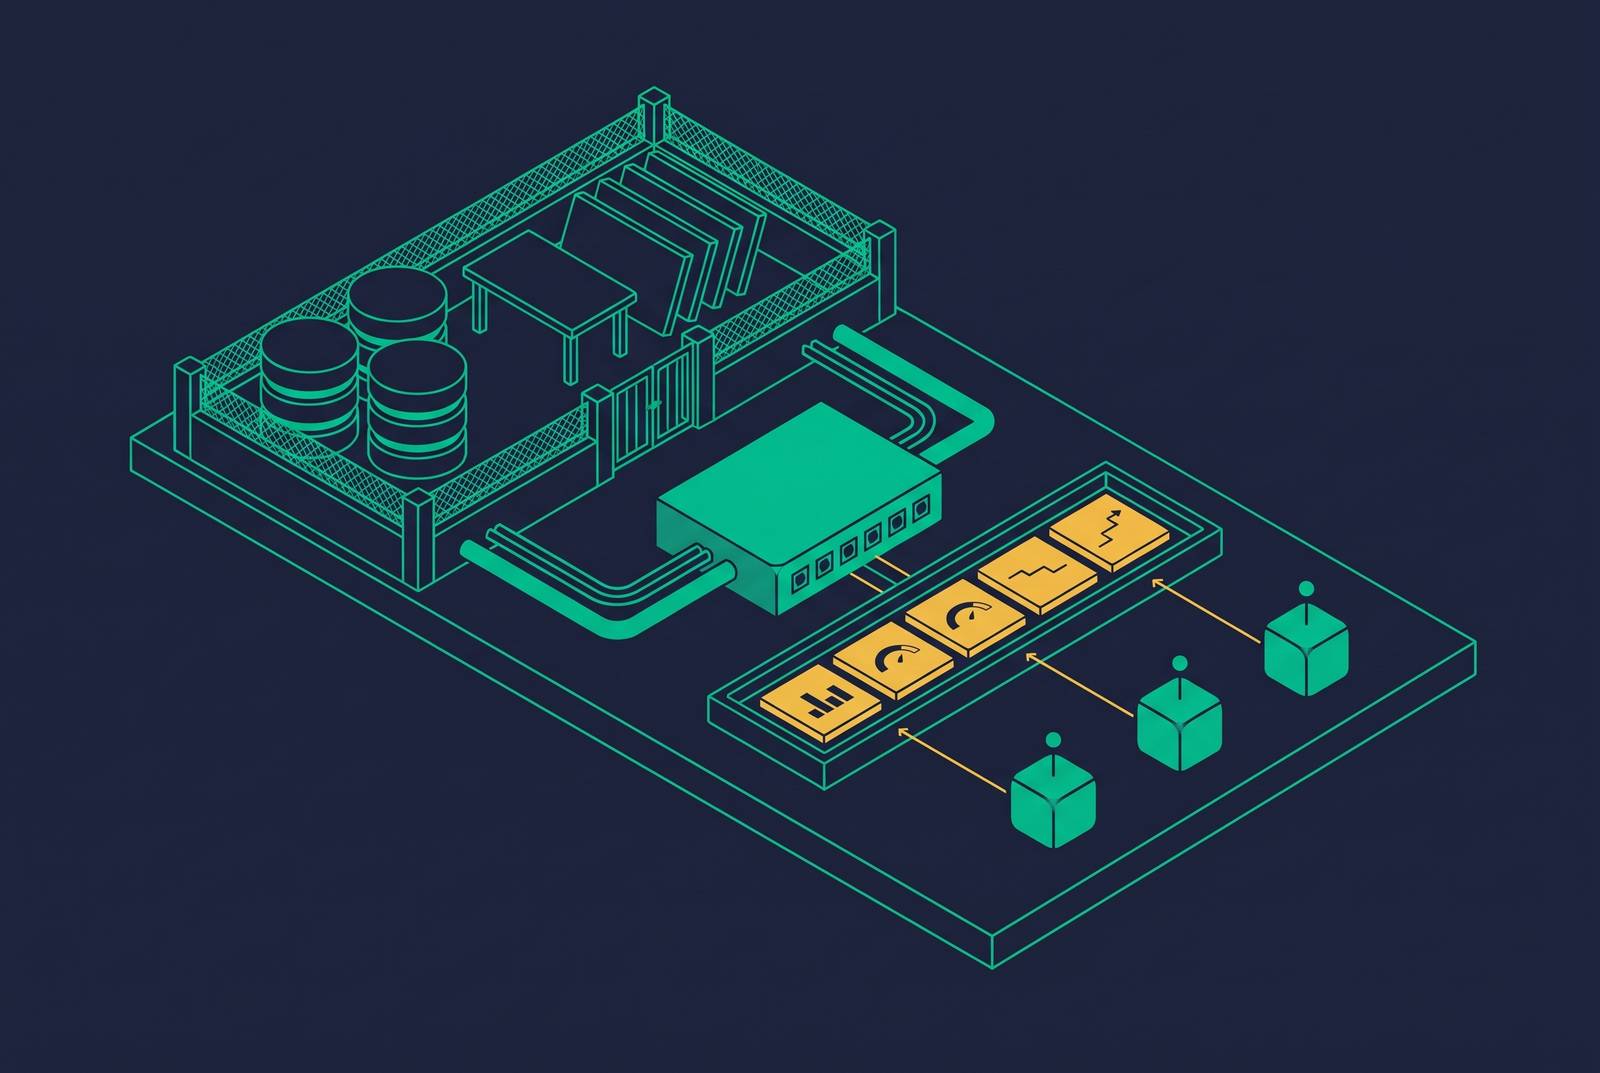
Agents should query Supabase through a dedicated MCP analytics server that exposes governed metric views, functions, and pre-calculated datasets. The server should offer named, parameterized tools under scoped permissions, with row-level access controls enforced in the database. This is an architecture decision before it is an integration task, because the interface determines the accuracy, safety, and cost of agent answers.
Why AI agents querying raw Postgres tables is an architecture problem, not just a security concern
A database schema does not define a business metric. When agents query raw tables, each can invent its own interpretation of the relationships and fields that produce ARR, churn, CAC, or MAU. A query can therefore run successfully and still give the wrong business answer. Authorization controls access to rows.
This resembles the N×M integration problem that preceded MCP, when every agent-to-data connection required a bespoke connector. Direct table access creates a semantic version of the same fragmentation, with each agent independently interpreting the schema. Standardizing the connection does not standardize the calculation.
A service-role key bypasses all Row Level Security policies and provides unrestricted database access, making it appropriate for schema migrations but not agent sessions involving user data. Agents querying production tables can also issue full scans. Pre-calculated datasets remove that class of production query entirely, rather than relying on an agent to choose an economical execution path.
What MCP actually is and what it hands agents permission to do
The Model Context Protocol, or MCP, standardizes how agents discover and call external systems. Its architecture has three components, which are the host AI application, the client connector inside that host, and the server that executes against the underlying system and returns results. The server defines the available surface. For analytics, that surface can be a catalog of approved metrics.
Servers expose Tools for actions, Resources for readable data, and Prompts for reusable templates. A governed analytics server exposes Resources and Tools that use modeled data. MCP gives compatible applications, including Claude, Copilot, and custom agents, a common way to discover and use the APIs doing the underlying work.
That reuse concentrates responsibility at the server boundary. Building the connection once is valuable only if the permissions and definitions behind it are suitable for every authorized consumer. Dmitry Korzhov, AI Product Lead at Improvado, states the consequence plainly. “MCP does not remove the need for a governed data layer. It makes the governance more important, because AI agents will expose every naming gap, permission gap, and metric-definition conflict faster.”
The July 2026 spec change that makes a stateless MCP analytics server practical at scale
The MCP 2026-07-28 specification retired protocol-level session state, removing a persistent-connection bottleneck for multi-tenant analytics servers. It removed the initialize/initialized handshake and the Mcp-Session-Id header. Each request now carries its protocol version, client identity, and client capabilities in _meta. Requests can go to any instance behind a round-robin load balancer without the instances having to share session storage.
Mcp-Method appears on all requests, while Mcp-Name identifies the tool, resource, or prompt on tools/call, resources/read, and prompts/get requests. Gateways can route and authorize using those headers without parsing JSON bodies. For analytics, this supports per-tool access controls and rate limits at the boundary.
The specification gives list responses deterministic ordering and cache hints, so clients can retain a stable catalog and avoid repeatedly discovering the same metrics. These hints concern discovery. Applications can still keep state by passing explicit handles between calls, and Multi Round-Trip Requests replaces exchanges that used to need held-open streams, including clarification requests.
How Supabase exposes data by default and where the governed layer has to intervene
On 30 October 2026, existing Supabase projects switch to the default under which new public-schema tables require explicit grants before the data API exposes them. Supabase introduced this change in late April 2026 and made it the default for new projects from May 30, 2026. The change closes a route to accidental exposure. It does not replace the need to inspect existing grants and row policies.
RLS enforces granular authorization inside Postgres. Without it, a table in an exposed schema is readable and writable by roles with the corresponding grants. The implementation requirement is therefore to enable RLS on every table in an exposed schema. Explicit API exposure and row authorization solve different problems, so neither should stand in for the other.
RLS performance is a design issue. Wrapping auth.uid() in a select keeps the call from running for every row, and indexing policy columns keeps table scans from running when they are not needed. Shared lookups can move into a security definer function. For analytics views on Postgres 15 and above, security_invoker = true makes underlying access follow the caller’s permissions and RLS. The MCP server must use a scoped role.
What the governed metrics layer actually is — views, functions, and pre-calculated datasets instead of tables
A governed metrics layer consists of defined database objects, prepared datasets, and scoped permissions. Views and functions form the contract between the analytics backend and its consumers. Metrics such as ARR, churn, CAC, and MAU are defined once in SQL views or machine-readable definitions such as YAML. The definition belongs outside the agent’s reasoning process. A dashboard and an agent then consume the same calculation.
This is the headless BI pattern, in which analytics is separate from presentation and available through open APIs. A chart-data endpoint alone is not enough. The backend needs metric definitions, access control, and caching to function as a governed analytical surface. Pre-calculated Parquet datasets, queryable through DuckDB, extend that separation by serving requests without touching production tables at query time.
Strategy Software’s Mosaic product demonstrates the shared-definition pattern in production. Agents built on Claude, Copilot, Gemini, and other systems query the certified definitions used by dashboards. PriceHubble uses the pattern for property data through its own MCP property-data backbone, which it opened to external early-access beta in Q1 2026. Companion and Copilot ground their outputs in PriceHubble data. These uses do not show that either product is a ready-made Supabase implementation.
How do teams build an MCP analytics server with scoped Supabase access?
The server should remain a thin interface over governed calculations. Its tools select approved views, functions, or datasets. The first implementation decision is a read-only analytics role with narrowly scoped grants. Agents get no database credentials or general-purpose query tool.
There is an important permission constraint in the proposed view pattern. A security-invoker view checks the caller’s underlying privileges, so granting access only to the view does not by itself make the query executable. “No table-level grants” and direct invoker-view access cannot simply be treated as interchangeable requirements. Where strict isolation from production tables is required, the pre-calculated dataset path fits that requirement. A view-backed path needs its grants and RLS evaluated together.
Metric objects can use governed names such as mrr_by_month, active_users_28d, and churn_rate. Their definitions belong in the analytics layer, with RLS applied to underlying tables and policy columns indexed. Each MCP tool maps one-to-one to a metric view or function. Its parameters are date ranges or dimension filters, never free-form SQL. The Supabase connection remains behind that constrained interface.
At the gateway, Mcp-Method and Mcp-Name support rejection of calls outside the allowed tool catalog before they reach the server. Catalog responses can use ttlMs cache hints, while pre-calculated datasets refresh on a schedule. These are separate caching decisions. The stateless server can then run behind a round-robin load balancer under the July specification without shared protocol-session storage.
Observability for the MCP server — tracing calls from agent to metric and back
A controlled interface is not automatically an observable one. Production operation requires visibility into which metrics agents request, whether they use the definitions consistently, and where calls fail. OpenTelemetry GenAI semantic conventions include mcp.method.name, mcp.protocol.version, and mcp.session.id. MCP spans can correlate with the wider agent trace in standard observability tooling. With protocol sessions retired, the session attribute should not be mistaken for a requirement to restore them.
Honeycomb.io reports that nearly 20% of its monthly interactive queries are made by agents. Teams should track tool names, call frequency, agent identity, and parameters, and flag errors or values outside expected ranges. These signals can reveal where metric definitions need refinement. Supabase-level log drains should feed the team’s existing observability setup in parallel with MCP tracing.
Visibility also needs a clear operational boundary. MCP is reactive: the server responds to requests and does not detect anomalies or send alerts on its own. A trace can explain an agent’s query without turning the server into a monitoring service. Teams seeking proactive intelligence need scheduled query automation above the MCP layer.
The strongest objection to governed metrics layers and where it has merit
Governed layers introduce latency, schema constraints, and maintenance work. Early-stage teams feel those costs sharply because their questions and definitions may still be changing. A semantic layer cannot anticipate every analytical request. Treating every new question as a modeling project can make exploration slower than the team can justify.
Metrics that drive decisions, including ARR, churn, MAU, and CAC, warrant governed definitions from day one. Exploratory queries can use a separate, clearly scoped interface that does not touch production. The distinction is between an authoritative answer and an investigation. Both are useful, but they do not need the same contract.
The alternative also imposes an early cost. A startup whose product dashboard, investor report, and growth spreadsheet define “monthly active users” differently already makes decisions on conflicting numbers. Leaving the definition to agents makes the disagreement easier to reproduce through more interfaces.
What teams should do next — the sequence that gets a governed MCP server into production
The next step is an exposure audit. Teams should identify public-schema tables without RLS, inspect grants, and account for the 30 October 2026 default change without relying on automatic exposure. Existing projects need particular attention to those assumptions. This establishes the boundary that later tool definitions must respect.
The core metric set comes next. Teams should choose the metrics they use to make business decisions and write each definition as a Postgres view, starting with a few and adding more as needed. The scoped analytics role follows those contracts, with permissions tested against the chosen view, function, or dataset path. No agent session should contain the service-role key. This is also where the invoker-view permission constraint must be resolved.
Only then should teams build or adopt the MCP server. Selection should turn on named metric tools, scoped access, row-level controls, parameterized inputs, and compatibility with the stateless deployment pattern. The tools should map one-to-one to governed metric objects, with header-based routing at the gateway. Catalog caching and scheduled dataset refreshes belong in that deployment plan.
Production readiness then requires OTel instrumentation connected to the team’s existing tooling and Supabase log drains configured in parallel. Error and parameter-range signals should make failures visible before broader agent use. If proactive monitoring is required, scheduled query automation is a separate deployment task. Teams should release when the metric contract can be used and observed, which requires more than a working connection to Supabase.